![[Picture of observatory]](leirvog1.jpg)
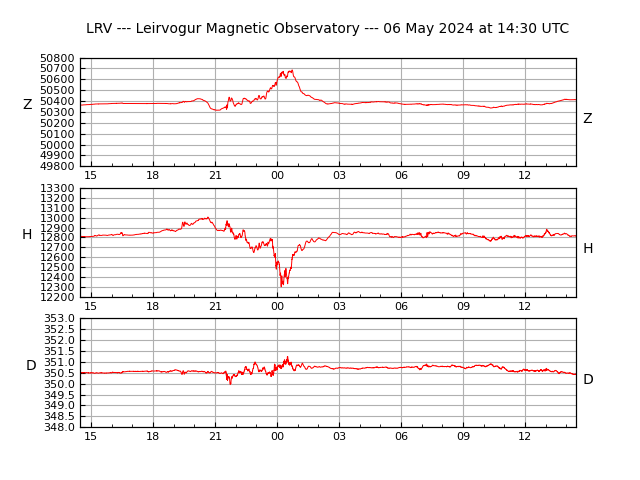
| The record above is updated every 10 minutes. The top graph (Z) shows
the vertical component of the geomagnetic field, the middle graph (H)
shows the horizontal component and the bottom graph (D) shows the
direction of that component, i.e. the direction of a compass needle at
Leirvogur. Z and H are shown in units of nanotesla (nT) while D is shown
in degrees, reckoned from north (0°) through east, south and west up to
360° (north, again). If D is 349°, for instance, the magnetic
declination (variation) at Leirvogur is 349° E or 11° W (360-349 = 11). The average declination in the Reykjavik area is about 2° higher
W, or ~13° W in this example. Yesterday's
record
Diagrams on this page were prepared by Gunnlaugur
Björnsson and Marteinn Sverrisson in April-May 2003. |